5 Dashboard's Web User Interface #
5.1 Log In #
To log in to the dashboard Web application, point your browser to its URL including the port number. You can find its address by running
cephadm@adm > ceph mgr services | grep dashboard
"dashboard": "https://ses-dash-node.example.com:8443/",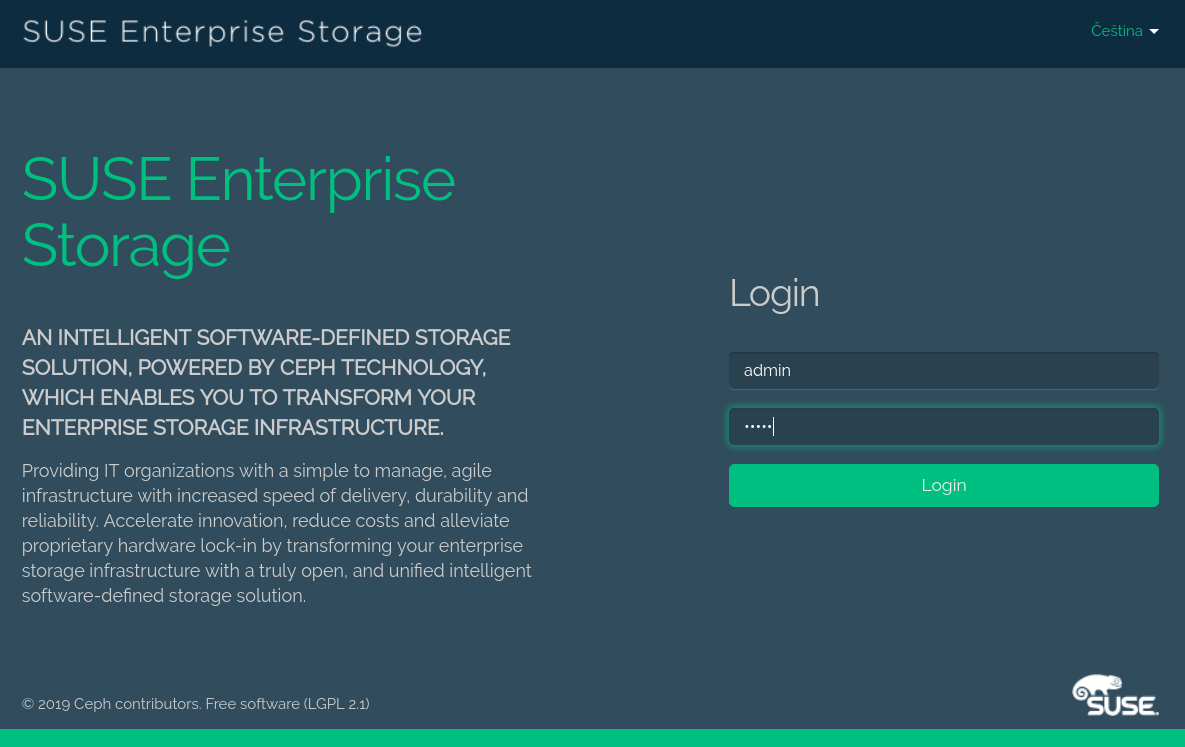
Figure 5.1: Ceph Dashboard Login Screen #
You need a user account in order to log in to the dashboard Web application. DeepSea creates a default user 'admin' with administrator privileges for you. If you decide to log in with the default 'admin' user, retrieve the corresponding password by running
root@master # salt-call grains.get dashboard_credsTip: Custom User Account
If you do not want to use the default 'admin' account to access the Ceph Dashboard, create a custom user account with administrator privileges. Refer to Chapter 14, Managing Users and Roles on the Command Line for more details.
The dashboard user interface is graphically divided into several blocks: the utility menu, the main menu, and the main content pane.
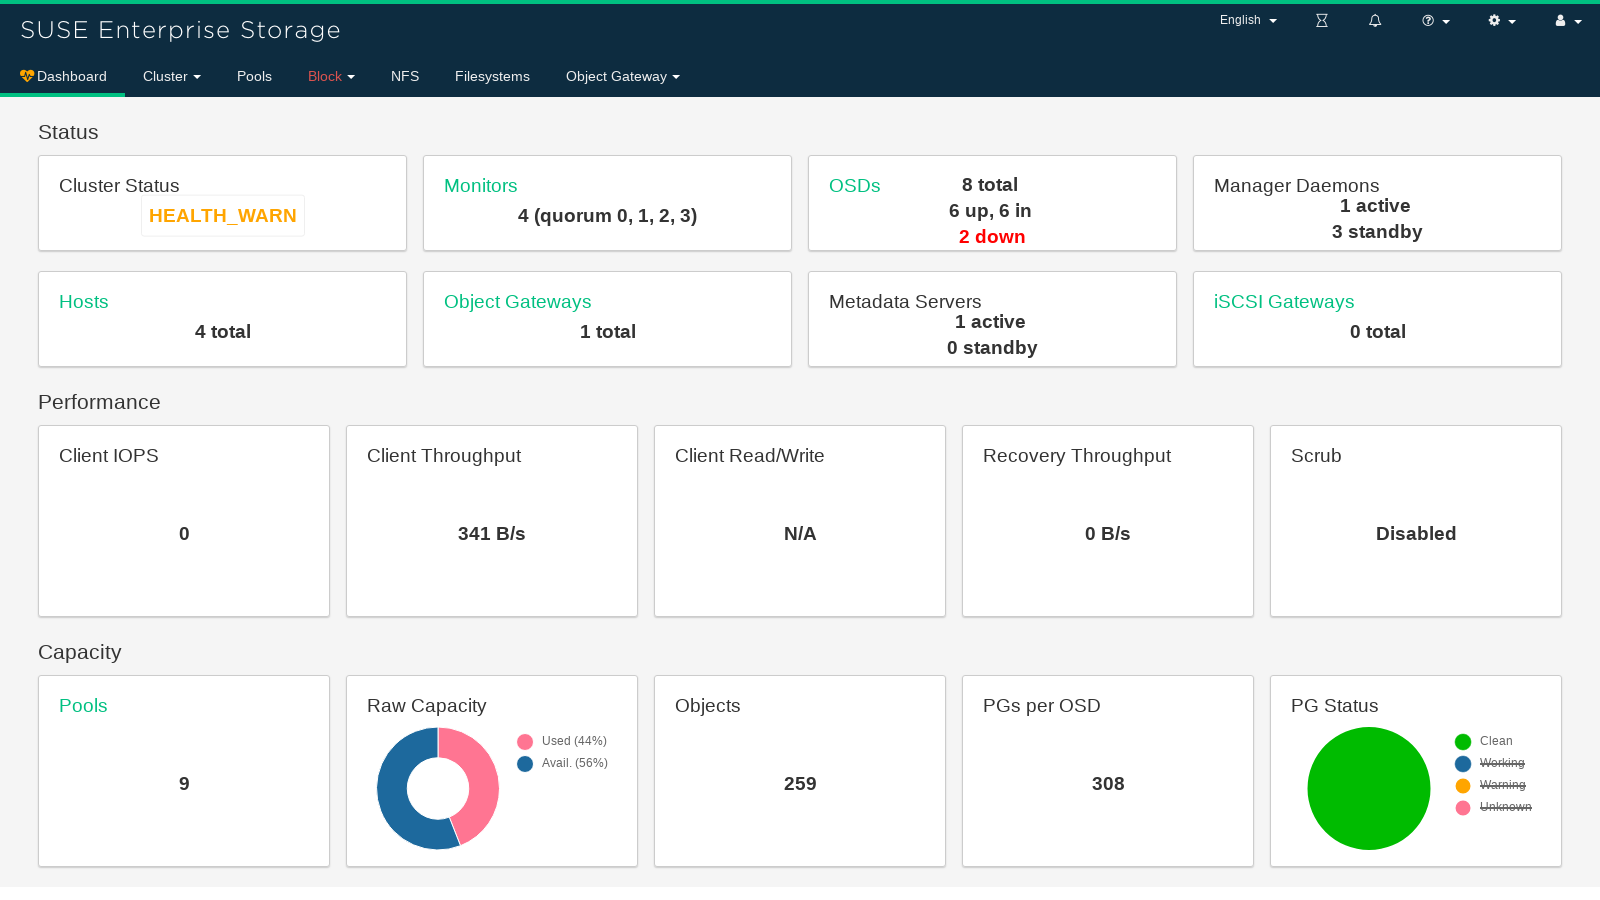
Figure 5.2: Ceph Dashboard Home Page #
5.4 The Content Pane #
The content pane occupies the main part of the dashboard's screen. The dashboard home page shows plenty of helpful widgets to inform you briefly about the current status of the cluster, capacity, and performance information.
5.5 Common Web UI Features #
In Ceph Dashboard, you often work with lists—for example, lists of pools, OSD nodes, or RBD devices. All lists will automatically refresh themselves by default every 5 seconds. The following common widgets help you manage or adjust these list:
Click  to trigger a manual refresh of the list.
Click  to display or hide individual table columns.
Click  and select how many rows to display on a single page.
Click inside  and filter the rows by typing the string to search for.
Use  to change the currently displayed page if the list
spans across multiple pages.
to change the currently displayed page if the list
spans across multiple pages.
5.6 Dashboard Widgets #
Each dashboard widget shows specific status information related to a specific aspect of a running Ceph cluster. Some widgets are active links and after clicking them, they will redirect you to a related detailed page of the topic they represent.
Tip: More Details on Mouse Over
Some graphical widgets show you more detail when you move the mouse over them.
5.6.1 Status Widgets #
widgets give you a brief overview about the cluster's current status.
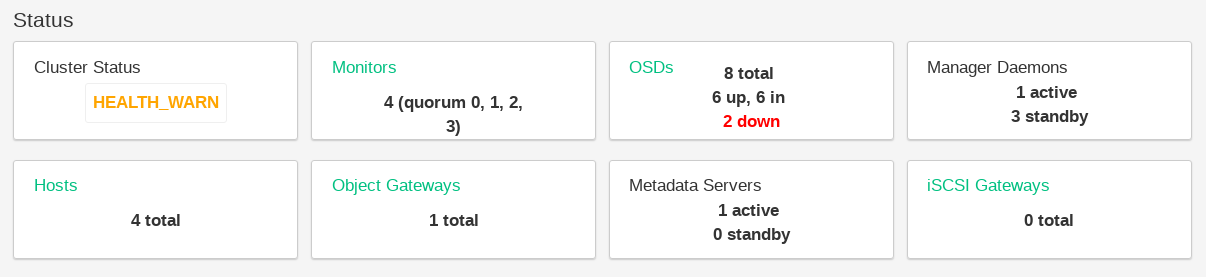
Figure 5.3: Status Widgets #
Presents basic information about the cluster's health.
Shows the number of running monitors and their quorum.
Shows the total number of OSDs, as well as the number of 'up' and 'in' OSDs.
Shows the number of active and standby Ceph Manager daemons.
Shows the total number of cluster nodes.
Shows the number of running Object Gateways.
Shows the number of Metadata Servers.
Shows the number of configured iSCSI gateways.
5.6.2 Performance Widgets #
widgets refer to basic performance data of Ceph clients.
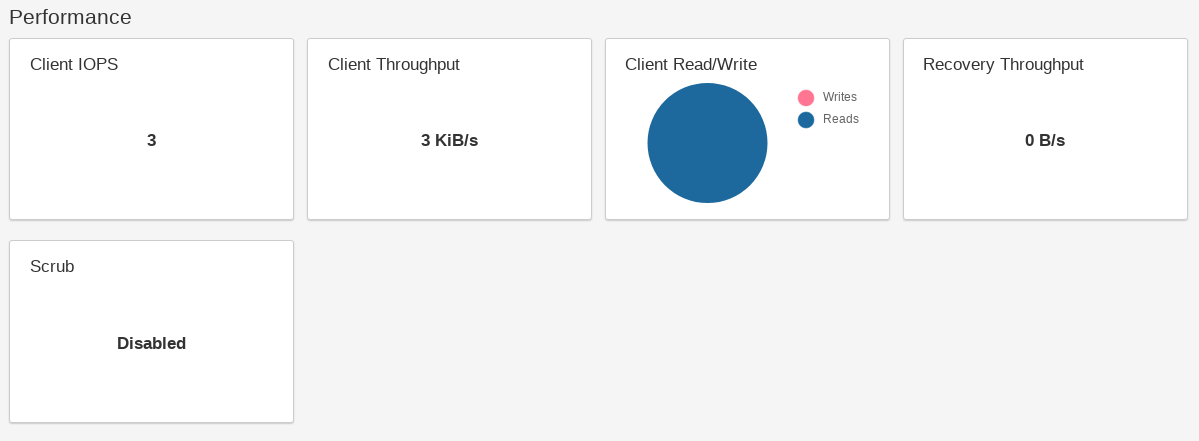
Figure 5.4: performance Widgets #
The amount of clients' read and write operations per second.
The sum of clients' read and write operations per second.
Visualizes clients' read/write ratio.
The throughput of data recovered per second.
Shows the scrub (see Section 20.4.9, “Scrubbing a Placement Group”) status. It is either disabled, enabled, or active.
5.6.3 Capacity Widgets #
widgets show brief information about the storage capacity.
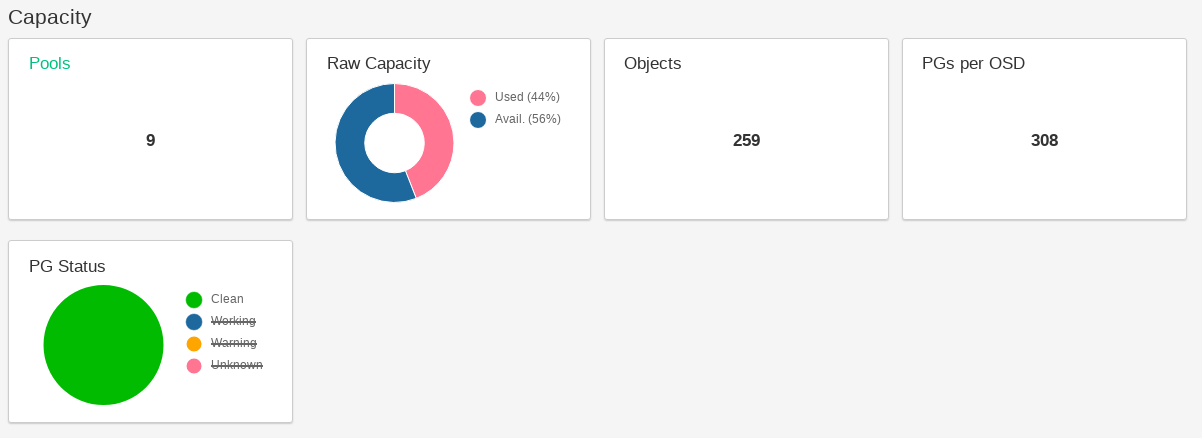
Figure 5.5: Capacity Widgets #
Shows the number of pools in the cluster.
Shows the ratio of used and available raw storage capacity.
Shows the number of data objects stored in the cluster.
Shows the number of placement groups per OSD.
Displays a chart of the placement groups according to their status.