7 Viewing Cluster Internals #
The menu item lets you view detailed information about Ceph cluster hosts, OSDs, MONs, CRUSH Map, and the content of log files.
7.1 Cluster Nodes #
Click / to view a list of cluster nodes.
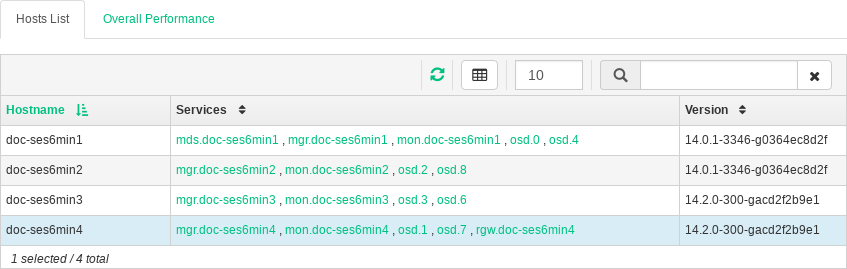
Figure 7.1: Hosts #
Click a node name in the column to view performance details of the node.
The column lists all daemons that are running on each related node. Click a daemon name to view its detailed configuration.
7.2 Ceph Monitors #
Click / to view a list of cluster nodes with running Ceph monitors. The list includes each monitor's rank number, public IP address, and number of open sessions.
The list is divided into two tables: one for Ceph Monitors that are in quorum, and the second one for Ceph Monitors that are not in quorum.
Click a node name in the column to view the related Ceph Monitor configuration.
The table shows general statistics about the running Ceph Monitors.
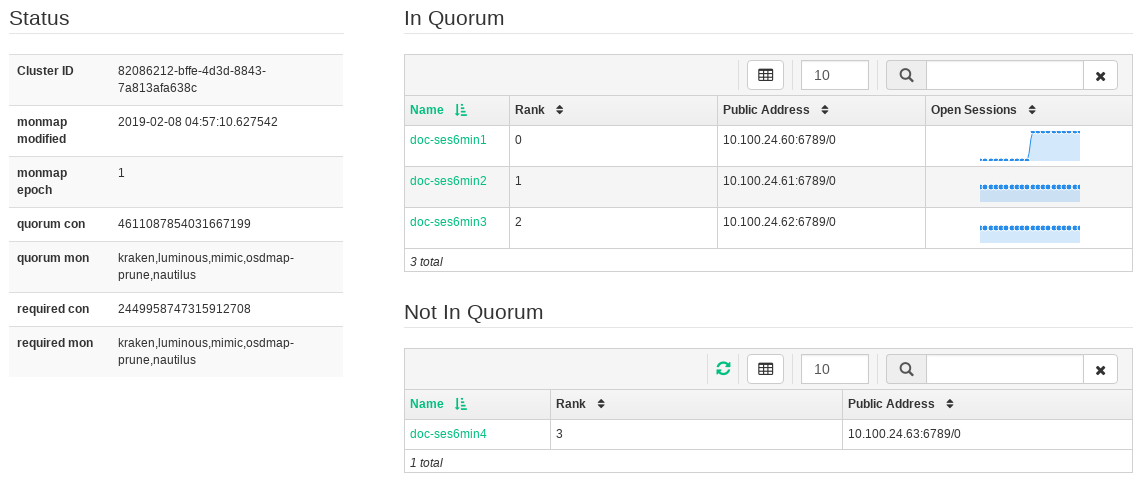
Figure 7.2: Ceph Monitors #
7.3 Ceph OSDs #
Click / to view a list of nodes with running OSD daemons/disks. The list includes each node's name, status, number of placement groups, size, usage, reads/writes chart in time, and the rate of read/write operations per second.
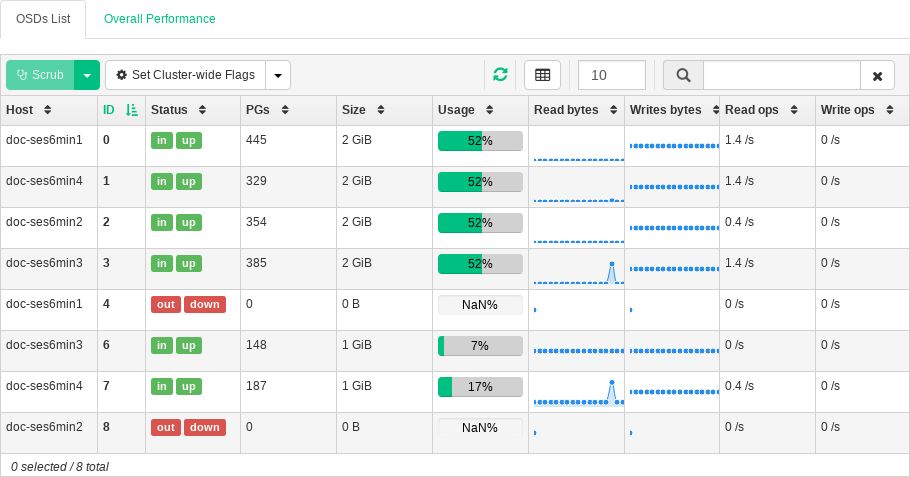
Figure 7.3: Ceph OSDs #
Click in the table heading to pop up a window with a list of flags that apply to the whole cluster. You can activate or deactivate individual flags, and confirm with .
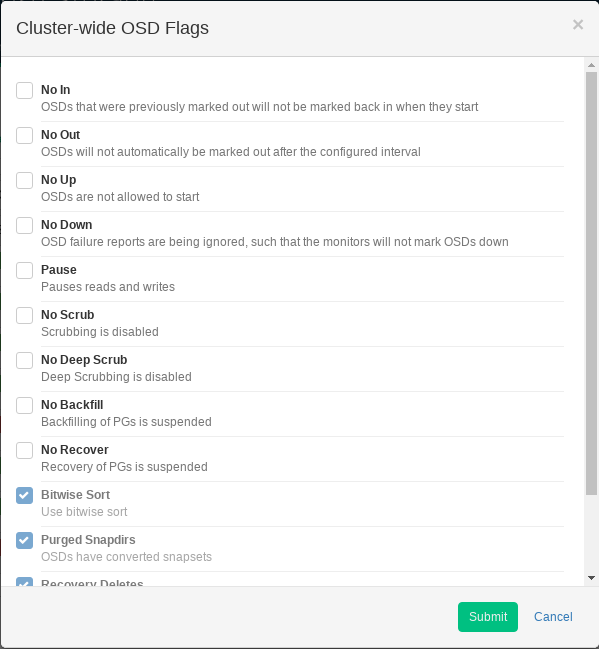
Figure 7.4: OSD Flags #
Click in the table heading to open a pop-up window with a list of OSD recovery priorities that apply to the whole cluster. You can activate the preferred priority profile, and fine tune the individual values below. Confirm with .
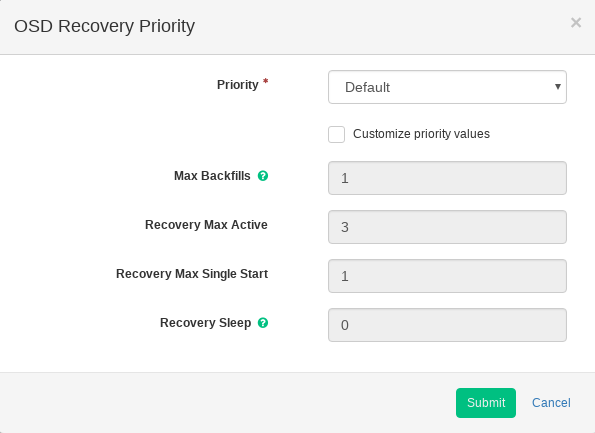
Figure 7.5: OSD Recovery Priority #
Click a node name in the column to view an extended table with details about the OSD setting and performance. Browsing through several tabs, you can see lists of , , , and a graphical of reads and writes.
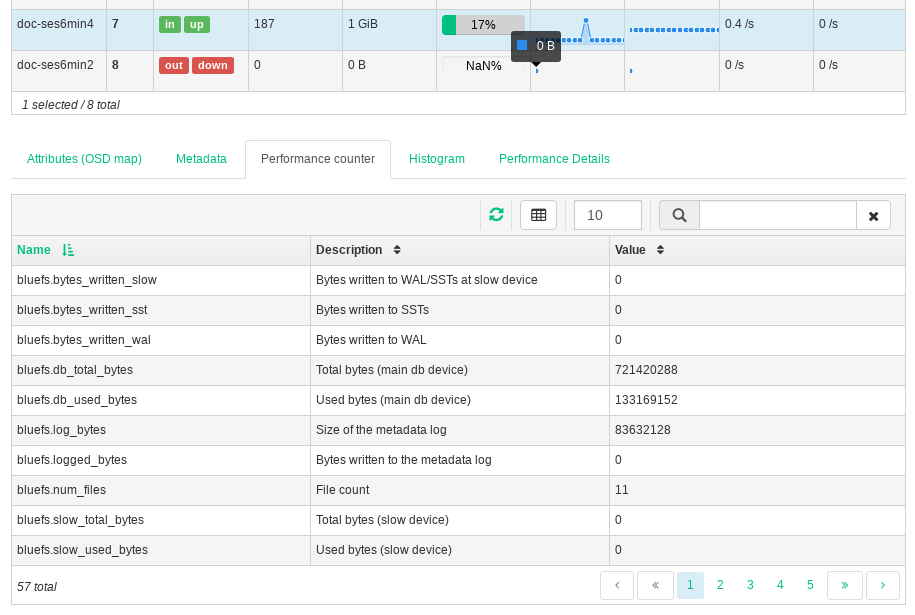
Figure 7.6: OSD Details #
Tip: Perform Specific Tasks on OSDs
After you click an OSD node name, its table row changes color slightly, meaning that you can now perform a task on the node. Click the down arrow in the top left of the table heading and select a task to perform, such as . Optionally enter a required value for the task, and confirm to run it on the node.
7.4 Cluster Configuration #
Click / to view a complete list of Ceph cluster configuration options. The list contains the name of the option, its short description, and its current and default values.
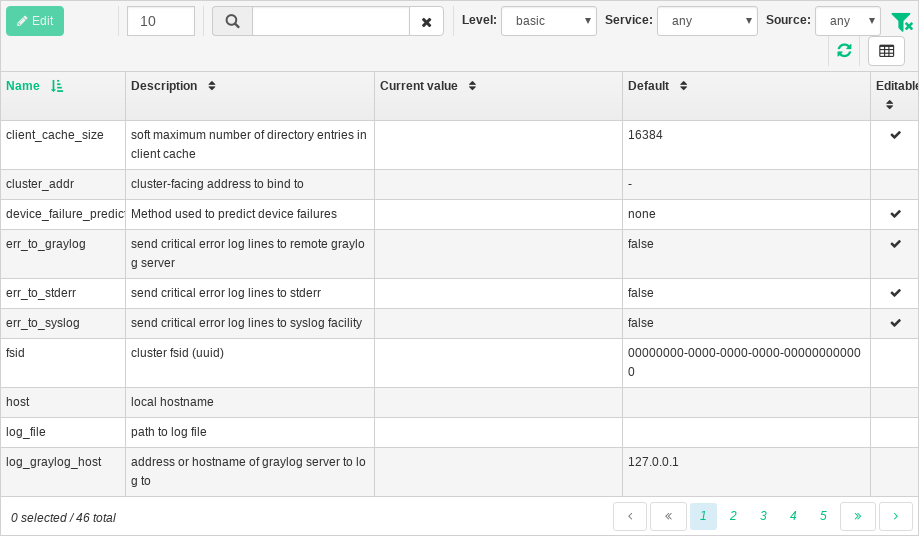
Figure 7.7: Cluster Configuration #
Click a specific option row to highlight and see detailed information about the option, such as its type of value, minimum and maximum permitted values, whether it can be updated at runtime, and many more.
After highlighting a specific option, you can edit its value(s) by clicking the button in the top left of the table heading. Confirm changes with .
7.5 CRUSH Map #
Click / to view a CRUSH Map of the cluster. For more general information on CRUSH Maps, refer to Section 20.5, “CRUSH Map Manipulation”.
Click the root, nodes, or individual OSDs to view more detailed information, such as crush weight, depth in the map tree, device class of the OSD, and many more.
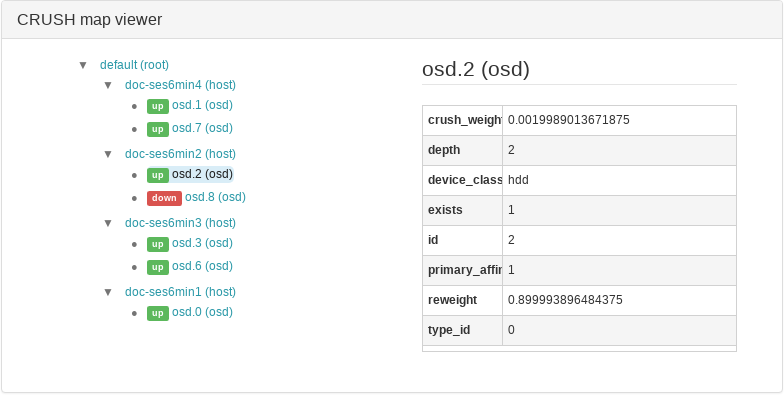
Figure 7.8: CRUSH Map #
7.6 Manager Modules #
Click / to view a list of available Ceph Manager modules. Each line consists of a module name and information on whether it is currently enabled or not.
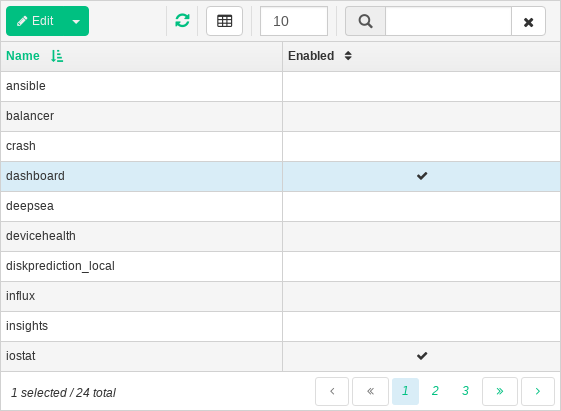
Figure 7.9: Manager Modules #
After highlighting a specific module, you can see its detailed settings in the table below. Edit them by clicking the button in the top left of the table heading. Confirm changes with .
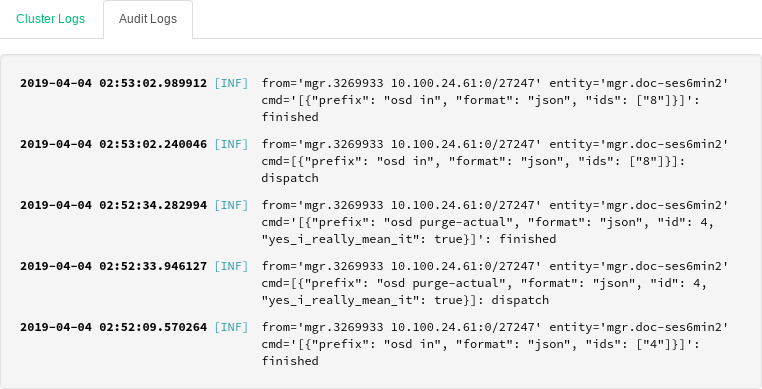
7.7 Logs #
Click / to view a list of cluster's recent log entries. Each line consists of a time stamp, the type of the log entry, and the logged message itself.
Click the tab to view log entries of the auditing subsystem. Refer to Section 14.4, “Auditing” for commands to enable or disable auditing.