Table of Contents
As more and more applications are deployed on cloud systems and cloud systems are growing in complexity, managing the cloud infrastructure is becoming increasingly difficult. SUSE OpenStack Cloud Crowbar Monitoring helps mastering this challenge by providing a sophisticated Monitoring as a Service solution that is operated on top of OpenStack-based cloud computing platforms.
The component architecture of OpenStack provides for high flexibility, yet it increases the burden of system operation because multiple services must be handled. SUSE OpenStack Cloud Crowbar Monitoring offers an integrated view of all services and assembles and presents related metrics and log data in one convenient access point. While being flexible and scalable to instantly reflect changes in the OpenStack platform, SUSE OpenStack Cloud Crowbar Monitoring provides the ways and means required to ensure multi-tenancy, high availability, and data security. The high availability architecture of SUSE OpenStack Cloud Crowbar Monitoring ensures an optimum level of operational performance eliminating the risk of component failures and providing for reliable crossover.
SUSE OpenStack Cloud Crowbar Monitoring covers all aspects of a Monitoring as a Service solution:
Central management of monitoring and log data from medium and large-size OpenStack deployments.
Storage of metrics and log data in a resilient way.
Multi-tenancy architecture to ensure the secure isolation of metrics and log data.
Horizontal and vertical scalability to support constantly evolving cloud infrastructures. When physical and virtual servers are scaled up or down to varying loads, the monitoring and log management solution can be adapted accordingly.
The monitoring solution of SUSE OpenStack Cloud Crowbar Monitoring addresses the requirements of large-scale public and private clouds where high numbers of physical and virtual servers need to be monitored and huge amounts of monitoring data need to be managed. SUSE OpenStack Cloud Crowbar Monitoring consolidates metrics, alarms, and notifications, as well as health and status information from multiple systems, thus reducing the complexity and allowing for a higher level analysis of the monitoring data.
SUSE OpenStack Cloud Crowbar Monitoring covers all aspects of a Monitoring as a Service solution:
Storage of monitoring data in a resilient way.
Multi-tenancy architecture for submitting and streaming metrics. The architecture ensures the secure isolation of metrics data.
Horizontal and vertical scalability to support constantly evolving cloud infrastructures. When physical and virtual servers are scaled up or down to varying loads, the monitoring solution can be adapted accordingly.
SUSE OpenStack Cloud Crowbar Monitoring offers various features which support you in proactively managing your cloud resources. A large number of metrics in combination with early warnings about problems and outages assists you in analyzing and troubleshooting any issue you encounter in your environment.
The monitoring features include:
A monitoring overview which allows you to access all monitoring information.
Metrics dashboards for visualizing your monitoring data.
Alerting features for monitoring.
In the following sections, you will find information on the monitoring overview and the metrics dashboards as well as details on how to define and handle alarms and notifications.
For accessing SUSE OpenStack Cloud Crowbar Monitoring and performing monitoring tasks, you must have access to the OpenStack platform as a user with the or role in the tenant.
Log in to OpenStack horizon with your user name and password. The functions you can use in OpenStack horizon depend on your access permissions. To access logs and metrics, switch to the tenant in horizon. This allows you to access all monitoring data for SUSE OpenStack Cloud Crowbar Monitoring.
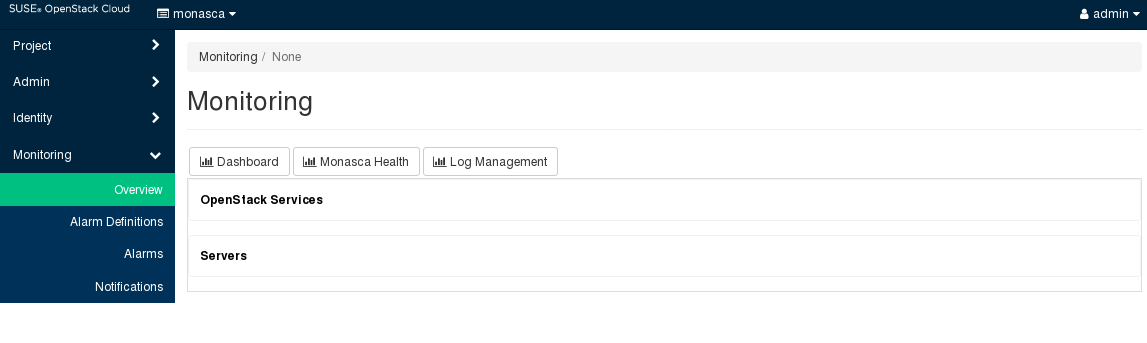
SUSE OpenStack Cloud Crowbar Monitoring provides one convenient access point to your monitoring data. Use to keep track of your services and servers and quickly check their status. The overview also indicates any irregularities in the log data of the system components you are monitoring.
On the page, you can:
View the status of your services, servers, and log data at a glance. As soon as you have defined an alarm for a service, a server, or log data and metrics data has been received, there is status information displayed on the page. Different colors are used for the different statuses.