The monitoring solution of SUSE OpenStack Cloud Crowbar Monitoring addresses the requirements of large-scale public and private clouds where high numbers of physical and virtual servers need to be monitored and huge amounts of monitoring data need to be managed. SUSE OpenStack Cloud Crowbar Monitoring consolidates metrics, alarms, and notifications, as well as health and status information from multiple systems, thus reducing the complexity and allowing for a higher level analysis of the monitoring data.
SUSE OpenStack Cloud Crowbar Monitoring covers all aspects of a Monitoring as a Service solution:
Storage of monitoring data in a resilient way.
Multi-tenancy architecture for submitting and streaming metrics. The architecture ensures the secure isolation of metrics data.
horizontal and vertical scalability to support constantly evolving cloud infrastructures. When physical and virtual servers are scaled up or down to varying loads, the monitoring solution can be adapted accordingly.
The basic usage scenario of setting up and using the monitoring features of SUSE OpenStack Cloud Crowbar Monitoring looks as follows:
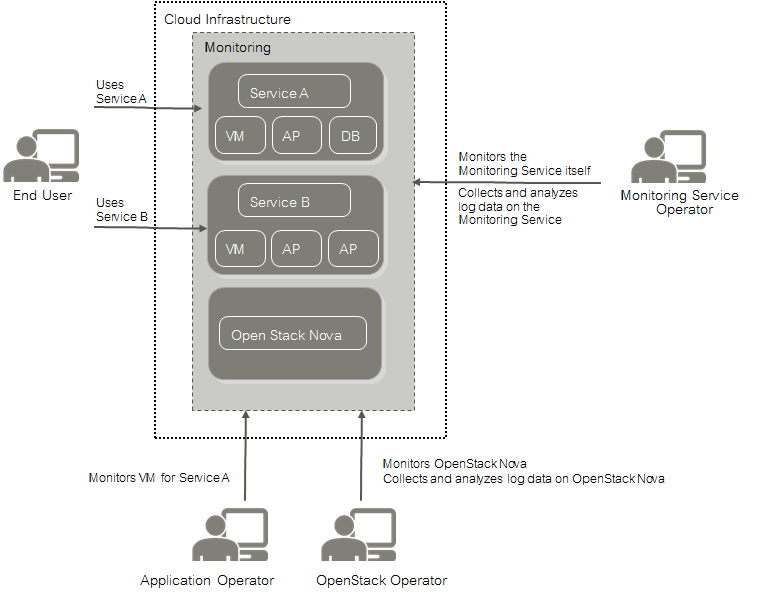
The Monitoring Service operator is responsible for providing the monitoring features to the application operators and the OpenStack operator. This enables the application operators and the OpenStack operator to focus on operation and ensure the quality of their services without having to carry out the tedious tasks implied by setting up and administrating their own system monitoring software. The Monitoring Service operator uses the features for monitoring the operation of SUSE OpenStack Cloud Crowbar Monitoring.
As the Monitoring Service operator, you have the following responsibilities:
Deploying the Monitoring Service, thus providing the monitoring features to the application operators, and the monitoring and log management features to the OpenStack operator.
Regular maintenance of the components and services for SUSE OpenStack Cloud Crowbar Monitoring.
Backup of the SUSE OpenStack Cloud Crowbar Monitoring databases, configuration files, and customized dashboards.
Monitoring of SUSE OpenStack Cloud Crowbar Monitoring for quality assurance.
Application operators monitor the virtual machines on which they provide services to end users or services they need for their development activities. They ensure that the physical and virtual servers on which their services are provided are up and running as required.
The OpenStack operator is responsible for administrating and maintaining the underlying OpenStack platform. The monitoring and log management services of SUSE OpenStack Cloud Crowbar Monitoring enable you to ensure the availability and quality of your platform. You use SUSE OpenStack Cloud Crowbar Monitoring for:
Monitoring physical and virtual servers, hypervisors, and OpenStack services.
Monitoring middleware components, for example, database services.
Retrieving and analyzing the log data of the OpenStack services and servers, the middleware components, and the operating system.
A Metrics Agent can be installed and configured on each physical and virtual server where cloud resources are to be monitored. The agent is responsible for querying metrics and sending the data to the Monitoring Service for further processing.
Metrics are self-describing data structures that are uniquely identified by a name and a set of dimensions. Each dimension consists of a key/value pair that allows for a flexible and concise description of the data to be monitored, for example, region, availability zone, service tier, or resource ID.
The Metrics Agent supports various types of metrics including the following:
System metrics, for example, CPU usage, consumed disk space, or network traffic.
Host alive checks. The agent can perform active checks on a host to determine whether it is alive using ping (ICMP) or SSH.
Process checks. The agent can check and monitor a process, for example, the number of instances, memory size, or number of threads.
HTTP endpoint checks. The agent can perform up/down checks on HTTP endpoints by sending an HTTP request and reporting success or failure to the Monitoring Service.
Service checks. The agent can check middleware services, for example, MySQL, Kafka, or RabbitMQ.
OpenStack services. The agent can perform specific checks on each process that is part of an OpenStack service.
Log metrics. The agent can check and monitor the number of critical log entries in the log data retrieved from the cloud resources.
All SUSE OpenStack Cloud Crowbar Monitoring user groups work with a graphical user interface that is seamlessly integrated into their cloud infrastructure. Based on OpenStack horizon, the user interface enables access to all monitoring functionality and the resulting large-scale monitoring data.
A comfortable dashboard visualizes the health and status of the cloud resources. It allows SUSE OpenStack Cloud Crowbar Monitoring users to experiment with many ways of analyzing the performance of their cloud resources in real-time. They cannot only view but also share and explore visualizations of their monitoring data.
SUSE OpenStack Cloud Crowbar Monitoring supports GUI-based alarm and notification management. Template-based alarm definitions allow for monitoring a dynamically changing set of resources without the need for reconfiguration. While the number of underlying virtual machines is changing, for example, this ensures the efficient monitoring of scalable cloud services. Alarm definitions allow you to specify expressions that are evaluated based on the metrics data that is received. Alarm definitions can be combined to form compound alarms. Compound alarms allow you to track and process even more complex events. Notifications can be configured in order to inform SUSE OpenStack Cloud Crowbar Monitoring users when an alarm is triggered.