The following illustration provides an overview of the main components of SUSE OpenStack Cloud Crowbar Monitoring and their interaction:
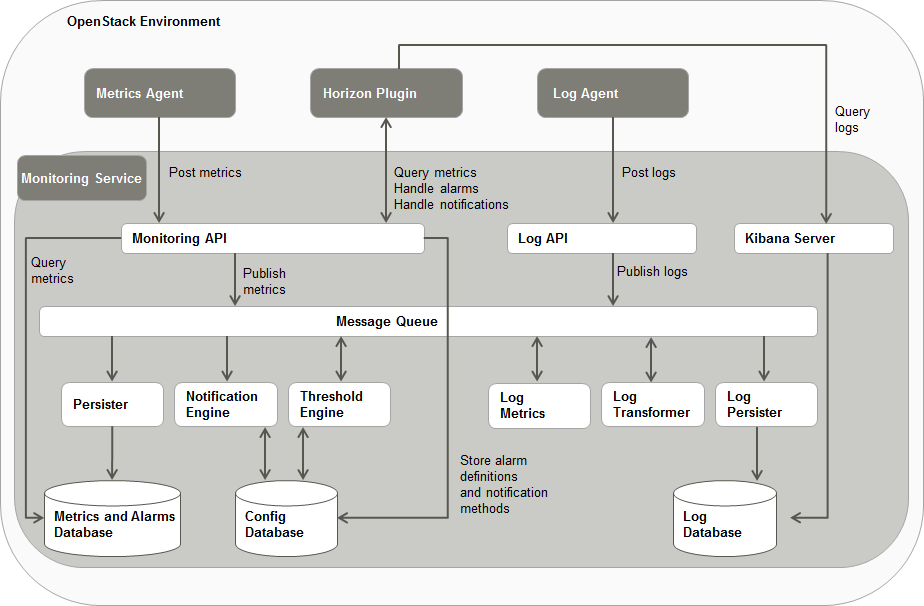
OpenStack
SUSE OpenStack Cloud Crowbar Monitoring relies on OpenStack as technology for building cloud computing platforms for public and private clouds. OpenStack consists of a series of interrelated projects delivering various components for a cloud infrastructure solution and allowing for the deployment and management of Infrastructure as a Service (IaaS) platforms.
Monitoring Service
The Monitoring Service is the central SUSE OpenStack Cloud Crowbar Monitoring component. It is responsible for receiving, persisting, and processing monitoring and log data, as well as providing the data to the users.
The Monitoring Service relies on monasca, an open source Monitoring as a Service solution. It uses monasca for high-speed metrics querying and integrates the Threshold Engine (streaming alarm engine) and the Notification Engine of monasca.
The Monitoring Service consists of the following components:
- Monitoring API
A RESTful API for monitoring. It is primarily focused on the following areas:
Metrics: Store and query massive amounts of metrics in real time.
Statistics: Provide statistics for metrics.
Alarm Definitions: Create, update, query, and delete alarm definitions.
Alarms: Query and delete the alarm history.
Notification Methods: Create and delete notification methods and associate them with alarms. Users can be notified directly when alarms are triggered, for example, via email.
- Message Queue
A component that primarily receives published metrics from the Monitoring API, alarm state transition messages from the Threshold Engine, and log data from the Log API. The data is consumed by other components, such as the Persister, the Notification Engine, and the Log Persister. The Message Queue is also used to publish and consume other events in the system. It is based on Kafka, a high-performance, distributed, fault-tolerant, and scalable message queue with durability built-in. For administrating the Message Queue, SUSE OpenStack Cloud Crowbar Monitoring uses Zookeeper, a centralized service for maintaining configuration information, naming, providing distributed synchronization, and providing group services.
- Persister
A monasca component that consumes metrics and alarm state transitions from the Message Queue and stores them in the Metrics and Alarms Database (InfluxDB).
- Notification Engine
A monasca component that consumes alarm state transition messages from the Message Queue and sends notifications for alarms, such as emails.
- Threshold Engine
A monasca component that computes thresholds on metrics and publishes alarms to the Message Queue when they are triggered. The Threshold Engine is based on Apache Storm, a free and open distributed real-time computation system.
- Metrics and Alarms Database
An InfluxDB database used for storing metrics and the alarm history.
- Config Database
A MariaDB database used for storing configuration information, alarm definitions, and notification methods.
- Log API
A RESTful API for log management. It gathers log data from the Log Agents and forwards it to the Message Queue.
The SUSE OpenStack Cloud Crowbar Monitoring log management is based on Logstash, a tool for receiving, processing, and publishing all kinds of logs. It provides a powerful pipeline for querying and analyzing logs. Elasticsearch is used as the back-end datastore, and Kibana as the front-end tool for retrieving and visualizing the log data.
- Log Transformer
A Logstash component that consumes the log data from the Message Queue, performs transformation and aggregation operations on the data, and publishes the data that it creates back to the Message Queue.
- Log Metrics
A monasca component that consumes log data from the Message Queue, filters the data according to severity, and generates metrics for specific severities, for example, for errors or warnings. The generated metrics are published to the Message Queue and can be further processed by the Threshold Engine like any other metrics.
- Log Persister
A Logstash component that consumes the transformed and aggregated log data from the Message Queue and stores it in the Log Database.
- Kibana Server
A Web browser-based analytics and search interface to the Log Database.
- Log Database
An Elasticsearch database for storing the log data.
horizon Plugin
SUSE OpenStack Cloud Crowbar Monitoring comes with a plugin for the OpenStack horizon dashboard. The plugin extends the main dashboard in OpenStack with a view for monitoring. This enables SUSE OpenStack Cloud Crowbar Monitoring users to access the monitoring functions from a central Web-based graphical user interface. For details, refer to the OpenStack horizon documentation.
Based on OpenStack horizon, the monitoring data is visualized on a comfortable and easy-to-use dashboard which fully integrates with the following applications:
- Grafana (for metrics data)
An open source application for visualizing large-scale measurement data.
- Kibana (for log data)
An open source analytics and visualization platform designed to work with Elasticsearch.
Metrics Agent
A Metrics Agent is required for retrieving metrics data from the host on which it runs and sending the metrics data to the Monitoring Service. The agent supports metrics from a variety of sources as well as a number of built-in system and service checks.
A Metrics Agent can be installed on each virtual or physical server to be monitored.
The agent functionality is fully integrated into the source code base of the monasca project. For details, refer to the monasca Wiki.
Log Agent
A Log Agent is needed for collecting log data from the host on which it runs and forwarding the log data to the Monitoring Service for further processing. It can be installed on each virtual or physical server from which log data is to be retrieved.
The agent functionality is fully integrated into the source code base of the monasca project. For details, refer to the monasca Wiki.
| Service Name | Description |
|---|---|
zookeeper
| Centralized service for maintaining configuration information, naming, providing distributed synchronization, and providing group services. |
storm-nimbus
| Storm is a distributed real-time computation system for processing large volumes of high-velocity data. The Storm Nimbus daemon is responsible for distributing code around a cluster, assigning tasks to machines, and monitoring for failures. |
storm-supervisor
| The Storm supervisor listens for work assigned to its machine and starts and stops worker processes as necessary based on what Nimbus has assigned to it. |
mariadb
| MariaDB database service. SUSE OpenStack Cloud Crowbar Monitoring stores configuration information in this database. |
kafka
| Message queue service. |
influxdb
| InfluxDB database service. SUSE OpenStack Cloud Crowbar Monitoring stores metrics and alarms in this database. |
elasticsearch
| Elasticsearch database service. SUSE OpenStack Cloud Crowbar Monitoring stores the log data in this database. |
memcached
| Memcached service. SUSE OpenStack Cloud Crowbar Monitoring uses it for caching authentication and authorization information required for the communication between the Log API and OpenStack keystone. |
openstack-monasca-notification
| Notification Engine. |
openstack-monasca-thresh
| Threshold Engine. |
openstack-monasca-log-transformer
| Log Transformer. |
apache2
| Log and monitoring API. |
openstack-monasca-persister
| Persister. |
openstack-monasca-agent
| Metrics Agent. |
kibana
| Kibana server. |
openstack-monasca-log-persister
| Log Persister. |
openstack-monasca-log-metrics
| Log Metrics. |
openstack-monasca-log-agent
| Log Agent. |