The following illustration provides an overview of the main components of SUSE OpenStack Cloud Crowbar Monitoring:
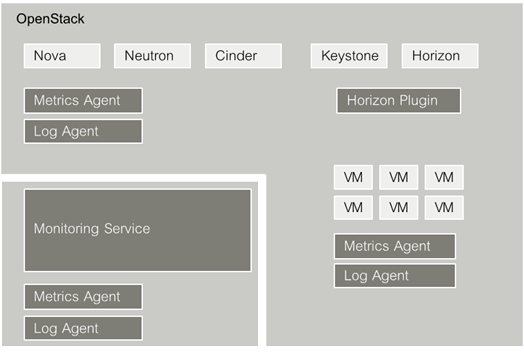
SUSE OpenStack Cloud Crowbar Monitoring relies on OpenStack as technology for building cloud computing platforms for public and private clouds. OpenStack consists of a series of interrelated projects delivering various components for a cloud infrastructure solution and allowing for the deployment and management of Infrastructure as a Service (IaaS) platforms.
For details on OpenStack, refer to the OpenStack documentation.
The Monitoring Service is the central SUSE OpenStack Cloud Crowbar Monitoring component. It is responsible for receiving, persisting, and processing metrics and log data, as well as providing the data to the users.
The Monitoring Service relies on monasca. It uses monasca for high-speed metrics querying and integrates the streaming alarm engine and the notification engine of monasca. For details, refer to the monasca Wiki.
SUSE OpenStack Cloud Crowbar Monitoring comes with a plugin for the OpenStack horizon dashboard. The horizon plugin extends the main dashboard in OpenStack with a view for monitoring. This enables SUSE OpenStack Cloud Crowbar Monitoring users to access the monitoring and log management functions from a central Web-based graphical user interface. Metrics and log data are visualized on a comfortable and easy-to-use dashboard.
For details, refer to the OpenStack horizon documentation.
Based on OpenStack horizon, the monitoring data is visualized on a comfortable and easy-to-use dashboard which fully integrates with the following applications:
Grafana (for metrics data). An open source application for visualizing large-scale measurement data.
Kibana (for log data). An open source analytics and visualization platform designed to work with Elasticsearch.
A Metrics Agent is required for retrieving metrics data from the host on which it runs and sending the metrics data to the Monitoring Service. The agent supports metrics from a variety of sources as well as a number of built-in system and service checks.
A Metrics Agent can be installed on each virtual or physical server to be monitored.
The agent functionality is fully integrated into the source code base of the monasca project. For details, refer to the monasca Wiki.
A Log Agent is needed for collecting log data from the host on which it runs and forwarding the log data to the Monitoring Service for further processing. It can be installed on each virtual or physical server from which log data is to be retrieved.
The agent functionality is fully integrated into the source code base of the monasca project. For details, refer to the monasca Wiki.