5 Operating System Level Tuning #
A significant amount of the performance tuning for Ceph clusters can be done at the operating system (OS) layer. This tuning involves ensuring that unnecessary services are not running, and extends down to ensuring buffers are not being overrun and interrupts are being spread properly. There are many additional tuning options for the OS that are not included here, either due to statistically-insignificant performance changes, or not being deemed candidates for significant performance improvement at the time of this work.
5.1 SUSE Linux Enterprise Install and Validation of Base Performance #
During the OS installation, do not select an install
pattern that includes an X Server. Doing so utilizes RAM and CPU resources
that would be better allocated to tuning storage-related daemons. We
recommend a pattern that includes the minimal pattern with the addition of
the YaST management pattern.
After the OS is installed, it is proper to evaluate the various individual components that are critical to the overall performance of the storage cluster.
Note
Check performance of individual components before SUSE Enterprise Storage is setup to ensure they are performing as desired.
5.1.1 Network Performance #
To perform iperf3 tests for network performance,
consider increasing the window size (with the -w option)
and running multiple streams to fully test the bandwidth capability. If
using the standard MTU, your NICs should be capable of running at
approximately 70-80% of the advertised bandwidth. If you move up to jumbo
frames, the NIC should be able to saturate the link.
This is not necessarily true for faster topologies such as 100 Gb. In those topologies, saturating the NIC can require substantial OS and driver tuning, in combination with ensuring the hardware has the appropriate CPU clock speeds and settings.
This is a sample of the iperf3 commands used on a
100 Gb network. In the command line, the -N disables
Nagle's buffering algorithm and the -l sets the buffer
length to higher than the default 128 kB, resulting in slightly higher
throughput.
  server# iperf3 -s

  client# iperf3   -c server -N -l 256k
  Connecting to host sr650-1, port 5201
  [  4] local 172.16.227.22 port 36628 connected to 172.16.227.21 port 5201
  [ ID] Interval           Transfer     Bandwidth       Retr  Cwnd
  [  4]   0.00-1.00   sec  4.76 GBytes  40.9 Gbits/sec    0   1.48 MBytes
  [  4]   1.00-2.00   sec  4.79 GBytes  41.1 Gbits/sec    0   2.52 MBytes
  [  4]   2.00-3.00   sec  4.73 GBytes  40.6 Gbits/sec    0   2.52 MBytes
  [  4]   3.00-4.00   sec  4.73 GBytes  40.6 Gbits/sec    0   2.52 MBytes
  [  4]   4.00-5.00   sec  4.74 GBytes  40.7 Gbits/sec    0   2.52 MBytes
  [  4]   5.00-6.00   sec  4.73 GBytes  40.6 Gbits/sec    0   2.52 MBytes
  [  4]   6.00-7.00   sec  4.72 GBytes  40.6 Gbits/sec    0   2.52 MBytes
  [  4]   7.00-8.00   sec  4.72 GBytes  40.6 Gbits/sec    0   2.52 MBytes
  [  4]   8.00-9.00   sec  4.73 GBytes  40.7 Gbits/sec    0   2.52 MBytes
  [  4]   9.00-10.00  sec  4.73 GBytes  40.6 Gbits/sec    0   2.52 MBytes
  - - - - - - - - - - - - - - - - - - - - - - - - -
  [ ID] Interval           Transfer     Bandwidth       Retr
  [  4]   0.00-10.00  sec  47.4 GBytes  40.7 Gbits/sec    0             sender
  [  4]   0.00-10.00  sec  47.4 GBytes  40.7 Gbits/sec                  receiver
5.1.2 Storage Performance #
Use fio to test individual storage devices to understand
the per-device performance maxima. Do this for all devices to ensure that
none are out of specification, or are connected to expanders which lower
bandwidth. Doing an exhaustive study of different I/O sizes and patterns
would provide the most information about performance expectations, but is
beyond the scope of this document.
We recommend testing at least random 4 kB, random 64 kB, and
sequential 64 kB and 1 MB buffers. This should give a reasonable
overall view of the device’s performance characteristics. When testing, it
is important to use the raw device
(/dev/sdX) and to use the
direct=1 option with multiple jobs to maximize device
performance under stress.
Make sure that the test size (dataset) is large enough to over-run any
caches that may apply. We recommend using the ramp-time
parameter to allow for enough time for the cache overrun to occur before
performance measurements are made. This helps to ensure that performance
numbers are not tainted by cache-only performance.
Run fio against all devices in an OSD node
simultaneously to identify bottlenecks. It should scale very near linearly;
if not, check controller firmware, slot placement, and if necessary, split
devices across multiple controllers. This simulates the node under heavy
load.
We recommend using the same I/O patterns and block sizes that the individual devices were tested with. The job count should be a multiple of the total number of devices in the system, to allow for even distribution across all devices and buses.
5.1.2.1 Latency Bound and Maximum #
There is value in performing both latency-bound and worst-case-scenario
tests. Changing a particular value may not improve latency, but rather
enable the cluster to handle even more total load, even though latencies
continue to rise. The inverse may also be true, where a change affects
latency of operations in a measurable way. To identify both possibilities,
we recommend that tests be performed that represent both positions.
Latency-bounded tests in fio have the following set:
  latency_target=10ms
  latency_window=5s
  latency_percentile=99
The settings above cause fio to increase the I/O queue
depth until 1% or more of IOPS no longer maintain a 10 ms average
during a sliding five-second window. It then backs down the queue depth
until the latency average is maintained.
5.2 Kernel Tuning #
There are several aspects of the kernel that can be tuned on both the cluster and some of the clients. It is important to understand that most tuning is about gaining very small incremental improvements, which in aggregate represent a measureable (and hopefully meaningful) improvement in performance. For this document, information on tuning comes from a variety of sources. The primary source is https://documentation.suse.com/sles/15-SP1/html/SLES-all/book-sle-tuning.html. We also used numerous other references, including documentation from hardware vendors.
5.2.1 CPU Mitigations #
One key area of kernel performance tuning is to disable its side-channel attack mitigations. The bulk of the benefits from this occur with smaller I/Os, ranging in size from 4 kB to 64 kB. In particular, 64 kB random read and sequential writes doubled in performance in a limited test environment using only two client nodes.
Changing these options requires a clear understanding of the security
implications, as they involve disabling mitigations for side-channel
attacks on some CPUs. The need to disable these mitigations may be
minimized with newer processors. You must carefully evaluate whether this
is something needed for the particular hardware being utilized. In the test
configuration, a Salt state was utilized to apply these changes. The
Salt state should be in a subdirectory of /srv/salt
on the Salt master and is applied by using a salt
state.apply command similar to below:
salt '*' state.apply my_kerntune
The Salt state and steps used in this testing can be found in
Appendix A, Salt State for Kernel Tuning. This needs to be adjusted to work in
each customer environment. An example of adjusting the
grub2 configuration file can also be found in the
appendix.
5.2.2 I/O tuning - Multiqueue Block I/O #
The first aspect to tune is to ensure that I/O is flowing in the most optimal pattern. For the test cluster used in this test, that means enabling multi-queue block I/O. This is done through adding a boot-time kernel parameter, as found in Section 12.4 https://documentation.suse.com/sles/15-SP1/html/SLES-all/cha-tuning-io.html#cha-tuning-io-barrier. This is not an action that should be taken unilaterally on clusters which contain spinning media devices, due to potential performance degradation for those devices. The general result is that there multiple I/O queues are assigned to each device, allowing more jobs to be handled simultaneously by those device that can service large numbers of requests, such as SSD and NVMe drives.
5.2.3 SSD Tuning #
To get the best read performance, it may be necessary to adjust the
read_ahead and write cache settings for the SSD devices.
In our particular testing environment, disabling write cache and forcing
read_ahead to 2 MB resulted in the best overall
performance.
Before tuning, it is important to check and record the default values, and measure any differences in performance compared to that baseline.
By placing the following file in /etc/udev/rules.d,
devices will be detected according to the model name shown in
/sys/block/{devname}/device/model, and instructed to
disable write caching and set the read_ahead_kb option to
2 MB.
  /etc/udev/rules.d/99-ssd.rules

  # Setting specific kernel parameters for a subset of block devices (Intel SSDs)
  SUBSYSTEM=="block", ATTRS{model}=="INTEL SSDS*", ACTION=="add|change", ATTR{queue/read_ahead_kb}="2048"
  SUBSYSTEM=="block", ATTRS{model}=="INTEL SSDS*", ACTION=="add|change", RUN+="/sbin/hdparm -W 0 /dev/%k"
5.2.4 Network Stack and Device Tuning #
Proper tuning of the network stack can substantially assist improving the latency and throughput of the cluster. A full script for the testing we performed can be found in Appendix C, Network Tuning.
The first change, and one with the highest impact, is to utilize jumbo frame packets. For this to be done, all interfaces utilizing the cluster must be set to use an MTU of 9000 bytes. Network switches are often set to use 9100 or higher. This is suitable, as they are only passing packets, not creating them.
5.2.4.1 Network Device Tuning #
5.2.4.1.1 Jumbo Frames #
The following Salt command ensures the bonded interfaces on all nodes under control (including the test load generation nodes) were utilizing an MTU of 9000:
salt '*' cmd.run 'ip link set bond0 mtu 9000'
To set this persistently, utilize YaST to set the MTU for the bonded interface.
5.2.4.1.2 PCIe Bus Adjustment #
Adjusting the PCIe maximum read request size can provide a slight boost to performance. Be aware that this tuning is card- and slot-specific and must only be done in conjunction with the conditions and instructions supplied by the manufacturer. The maximum PCIe read request size was set with the following Salt commands:
Warning
This should only be done with guidance from the NIC manufacturer and is specific to bus location, driver version and hardware.
  salt '*' cmd.run 'setpci -s 5b:00.0 68.w=5936'
  salt '*' cmd.run 'setpci -s 5b:00.1 68.w=5936'
5.2.4.1.3 TCP RSS #
The next item on the tuning list is helpful in ensuring that a single CPU core is not responsible for all packet processing. A small script is used to spread the I/O across multiple local (from a NUMA perspective) cores.
Note
This is not necessary if the number of queues returned by ls
/sys/class/net/{ifname}/queues/rx-*|wc -l is equal to the
number of physical cores in a single CPU socket.
salt '*' cmd.run 'for j in `cat /sys/class/net/bond0/bonding/slaves`;do \
LOCAL_CPUS=`cat /sys/class/net/$j/device/local_cpus`;echo $LOCAL_CPUS > \
/sys/class/net/$j/queues/rx-0/rps_cpus;done'
5.2.4.1.4 Ring Buffers #
Many NIC drivers start with a default value for the receive (RX) and transmit (TX) buffers that is not optimal for high-throughput scenarios, and does not allow enough time for the kernel to drain the buffer before it fills up.
The current and maximum settings can be revealed by issuing the following command to the proper NICs:
ethtool -g eth4
The output from this command should look similar to this:
  Ring parameters for eth4:
  Pre-set maximums:
  RX:		8192
  RX Mini:	0
  RX Jumbo:	0
  TX:		8192
  Current hardware settings:
  RX:		1024
  RX Mini:	0
  RX Jumbo:	0
  TX:		1024
Here we can see that the NIC can allocate buffers of up to 8 kB, but it iscurrently using ones of only 1 kB. To adjust this for the cluster, issue the following command:
  salt '*' cmd.run 'ethtool -G eth4 rx 8192 tx 8192'
  salt '*' cmd.run 'ethtool -G eth5 rx 8192 tx 8192'
Setting this value persistently can be achieved via the YaST configuration module:
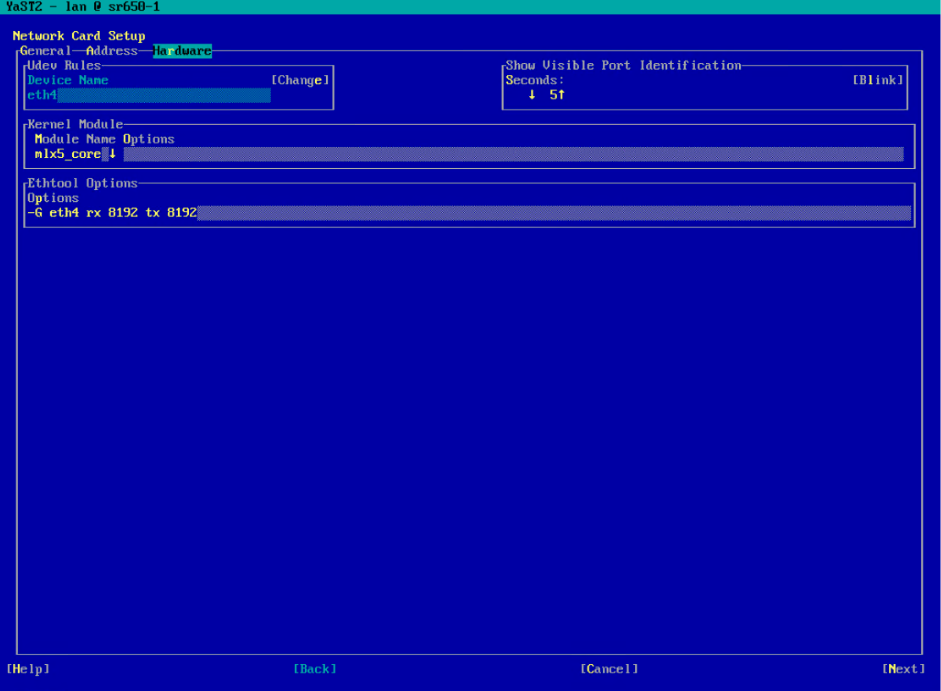
Figure 5.1: YaST Configuration Module #
Additionally, the settings can be made persistent by editing the
configuration files for the physical interfaces found in
/etc/sysconfig/network. A script can be found in
Appendix B that will change all interfaces to the maximum ring buffer
value.
5.2.4.2 Network Stack #
The following settings can all be made persistent by modifying
/etc/sysctl.conf. They are represented as arguments
in a Salt command to allow testing and validation in your environment
before making them permanent.
5.2.4.2.1 Lower TCP Latency #
Setting the TCP low latency option disables IPv4 TCP
pre-queue processing and improves latency. We recommend experimenting
with setting this to both 0 and 1.
In laboratory testing, setting the value to 1 provided
slightly better performance:
salt '*' cmd.run 'sysctl -w net.ipv4.tcp_low_latency=1'
The TCP fastopen option allows the sending of data in
the first syn packet, resulting in a slight
improvement in latency:
salt '*' cmd.run 'sysctl -w net.ipv4.tcp_fastopen=1'
5.2.4.2.2 TCP Stack Buffers #
Ensure that the TCP stack has sufficent buffer space to queue both inbound and outbound traffic:
salt '*' cmd.run 'sysctl -w net.ipv4.tcp_rmem="10240 87380 2147483647"'
salt '*' cmd.run 'sysctl -w net.ipv4.tcp_wmem="10240 87380 2147483647"'
5.2.4.2.3 TCP Sequence and Timestamps #
In fast networks, TCP sequence numbers can be re-used in a very short timeframe. The result is that the system thinks a packet has been received out of order, resulting in a drop. TCP timestamps were added to help ensure that packet sequence could be tracked better:
salt '*' cmd.run 'sysctl -w net.ipv4.tcp_timestamps=1'
TCP Selective Acknowledgement is a feature that is
primarily useful for WAN or lower-speed networks. However, disabling it
may have negative effects in other ways:
salt '*' cmd.run 'sysctl -w net.ipv4.tcp_sack=1'
5.2.4.2.4 Kernel Network Buffers and Connections #
Providing plenty of buffer space is a recurring theme in tuning networks
for high performance. The netdev_max_backlog is where
traffic is queued after it has been received by the NIC, but before it is
processed by the protocol stack (IP, TCP, etc):
salt '*' cmd.run 'sysctl -w net.core.netdev_max_backlog=250000'
Other preventative measures for the system and gateway nodes include
ensuring that the maximum connection count is high enough to prevent the
generation of syn cookies. This is useful to set on
all nodes involved:
salt '*' cmd.run 'sysctl -w net.core.somaxconn=2048'
Increasing the network stack buffers is useful to ensure that sufficient buffers exist for all transactions:
salt '*' cmd.run 'sysctl -w net.core.rmem_max=2147483647'
salt '*' cmd.run 'sysctl -w net.core.wmem_max=2147483647'