Table of Contents
SUSE OpenStack Cloud Monitoring offers various features which support you in proactively managing your cloud resources. A large number of metrics in combination with early warnings about problems and outages assists you in analyzing and troubleshooting any issue you encounter in your environment.
The monitoring features include:
-
A monitoring overview which allows you to access all monitoring information.
-
Metrics dashboards for visualizing your monitoring data.
-
Alerting features for monitoring.
In the following sections, you will find information on the monitoring overview and the metrics dashboards as well as details on how to define and handle alarms and notifications.
Accessing SUSE OpenStack Cloud Monitoring
For accessing SUSE OpenStack Cloud Monitoring and performing monitoring tasks, you must have access to the OpenStack platform as a user with the or role in the tenant.
Log in to OpenStack Horizon with your user name and password. The functions you can use in OpenStack Horizon depend on your access permissions. To access logs and metrics, switch to the tenant in Horizon. This allows you to access all monitoring data for SUSE OpenStack Cloud Monitoring.
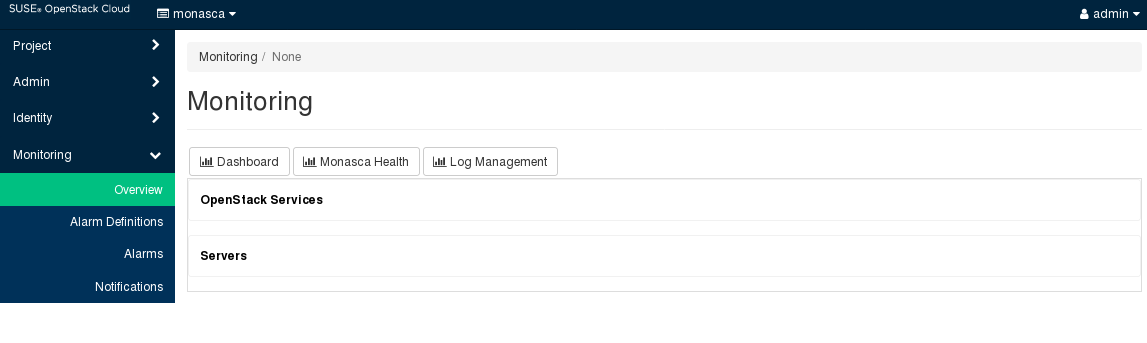
SUSE OpenStack Cloud Monitoring provides one convenient access point to your monitoring data. Use Monitoring > Overview to keep track of your services and servers and quickly check their status. The overview also indicates any irregularities in the log data of the system components you are monitoring.
On the Overview page, you can:
-
View the status of your services, servers, and log data at a glance. As soon as you have defined an alarm for a service, a server, or log data and metrics data has been received, there is status information displayed on the Overview page. Different colors are used for the different statuses.
For details on the status information, refer to the section called “Status of Services, Servers, and Log Data”. For details on defining alarms, refer to the section called “Defining Alarms”.
-
Access a preconfigured dashboard that visualizes your metrics data. Starting from this dashboard, you can create your own dashboards for visualizing your metrics data as required. For details, refer to the section called “Working with Data Visualizations”.
-
Access the SUSE OpenStack Cloud Monitoring log management functionality. For details, refer to Chapter 4, Log Management.