The user interface for monitoring your services, servers, and log data integrates with Grafana, an open source application for visualizing large-scale monitoring data. Use the options at the top border of the Overview page to access Grafana.
SUSE OpenStack Cloud Monitoring ships with preconfigured metrics dashboards. You can instantly use them for monitoring your environment. You can also use them as a starting point for building your own dashboards.
Preconfigured Metrics Dashboard for OpenStack
As an OpenStack operator, you use the Dashboard option on the Overview page to view the metrics data on the OpenStack services. The Monitoring Service operator uses the Dashboard option to view the metrics data on the Monitoring Service.
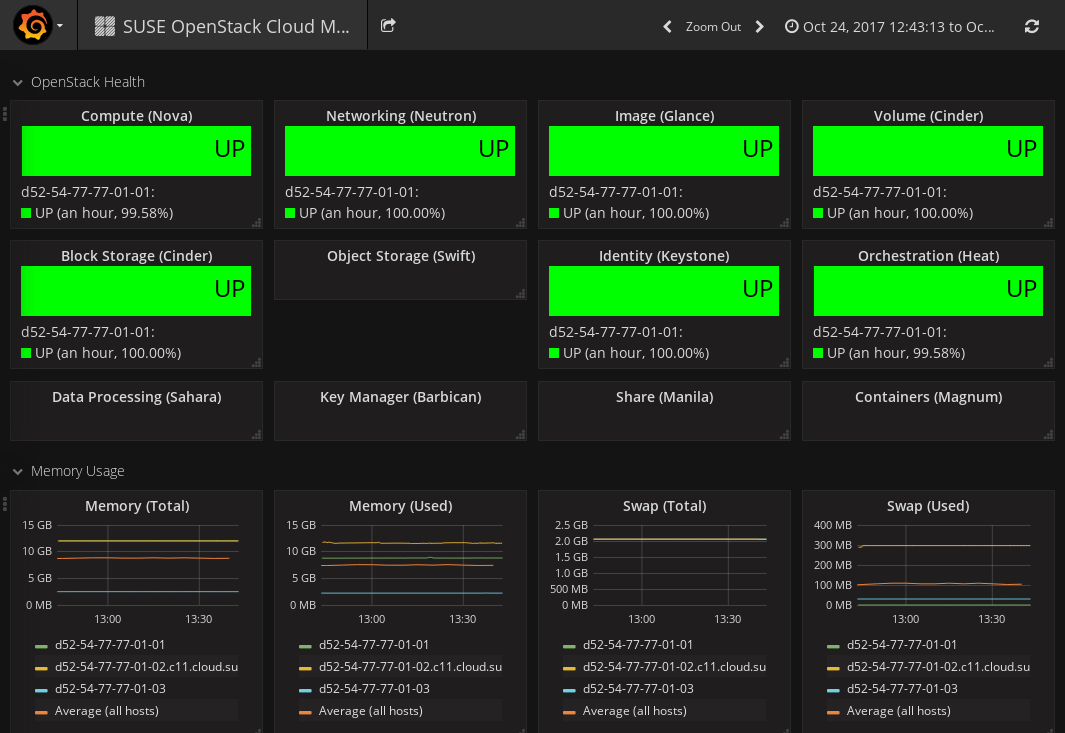
To monitor OpenStack, the preconfigured dashboard shows the following:
-
Status of the main OpenStack Services (
UPorDOWN). Information on Nova, Neutron, Glance, Cinder, Swift, and Keystone is displayed. -
Information on system resources.
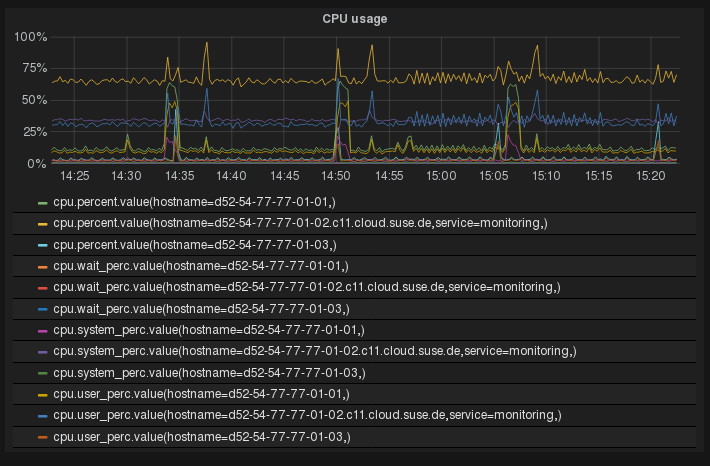
The dashboard shows metrics data on CPU usage: the percentage of time the CPU is used in total (
cpu.percent), at user level (cpu.user_perc), and at system level (cpu.system_perc), as well as the percentage of time the CPU is idle when no I/O requests are in progress (cpu.wait_perc).The dashboard shows metrics data on memory usage: the number of megabytes of total memory (
mem.total_mb), used memory (mem.used_mb), total swap memory (mem.swap_total_mb), and used swap memory (mem.swap_used_mb), as well as the number of megabytes used for the page cache (mem.used_cache).The dashboard shows metrics data on the percentage of disk space that is being used on a device (
disk.space_used_perc).The dashboard shows metrics data on the SUSE OpenStack Cloud Monitoring system load over different periods (
load.avg_1_min,load.avg_5_min, andload.avg_15_min). -
The network usage of SUSE OpenStack Cloud Monitoring.
The dashboard shows the number of network bytes received and sent per second (
net.in_bytes_secandnet.out_bytes_sec).
Building Dashboards
Each metrics dashboard is composed of one or more panels that are arranged in one or more rows. A row serves as a logical divider within a dashboard. It organizes your panels in groups. The panel is the basic building block for visualizing your metrics data.
For building dashboards, you have two options:
-
Start from scratch and create a new dashboard.
-
Take the dashboard that is shipped with SUSE OpenStack Cloud Monitoring as a starting point and customize it.
The following sections provide introductory information on dashboards, rows, and panels, and make you familiar with the first steps involved in building a dashboard. For additional information, you can also refer to the Grafana documentation.
Creating a Dashboard
To create a new dashboard, use Open icon in the top right corner of your dashboard window. The option provides access to various features for administrating dashboards. Click New to create an empty dashboard that serves as a starting point for adding rows and panels.
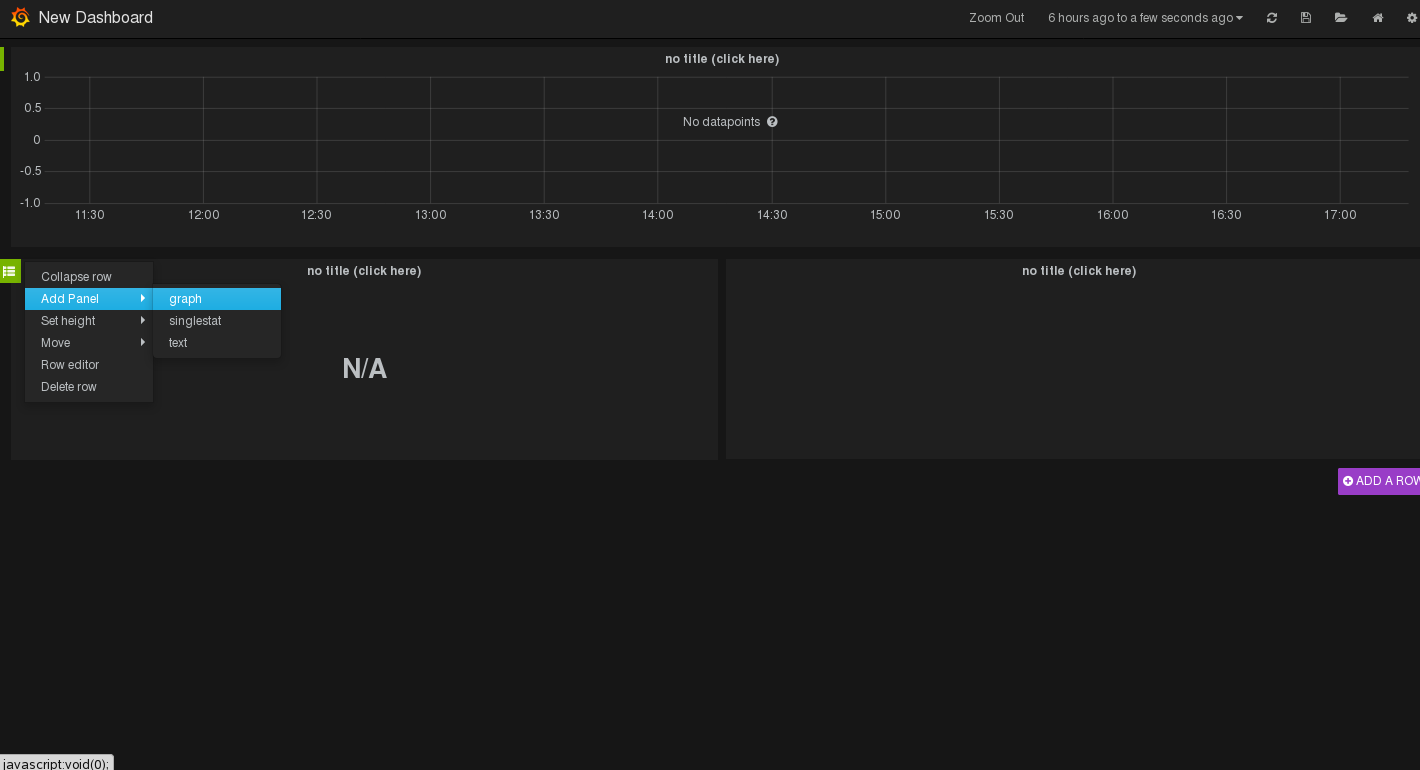 |
On the left side of an empty dashboard, there is a green rectangle displayed. Hover over this rectangle to access a Row menu. To insert your first panel, you can use the options in the Add Panel submenu. See below for details on the available panel types.
As soon as you have inserted an empty panel, you can add additional rows. For this purpose, use the Add Row option on the right side of the dashboard.
Editing Rows
Features for editing rows can be accessed via the green rectangle that is displayed to the left of each row.
In addition to adding panels to a row, you can collapse or remove a row, move the position of the row within your dashboard, or set the row height. Row settings allows you, for example, to insert a row title or to hide the Row menu so that the row can no longer be edited.
Editing Panels
Grafana distinguishes between three panel types:
Panels of type Graph are used to visualize metrics data. A query editor is provided to define the data to be visualized. The editor allows you to combine multiple queries. This means that any number of metrics and data series can be visualized in one panel.
Panels of type Singlestat are also used to visualize metrics data, yet they reduce a single query to a single number. The single number can be, for example, the minimum, maximum, average, or sum of values of the data series. The single number can be translated into a text value, if required.
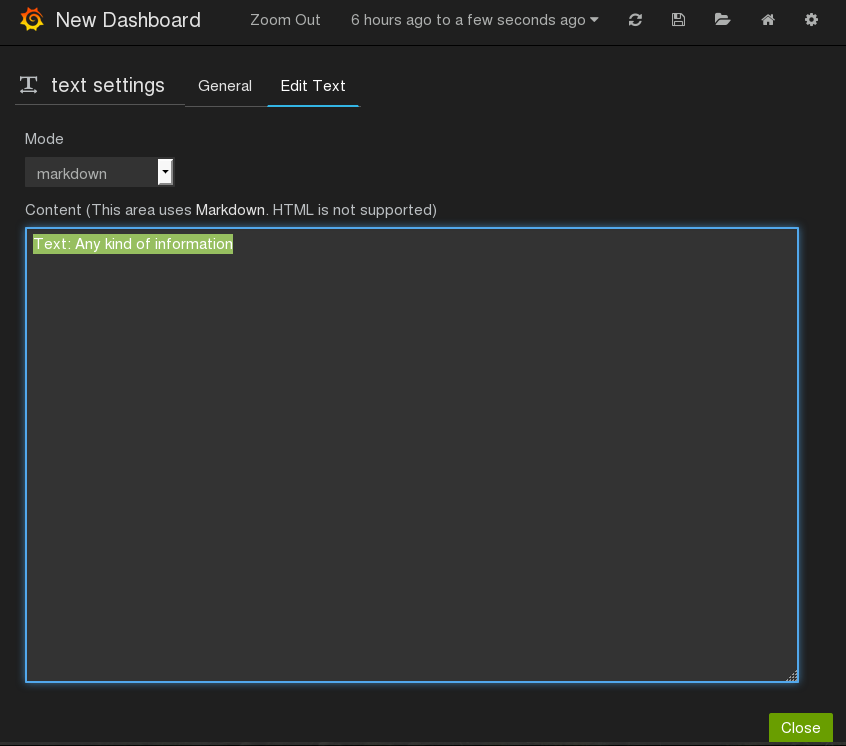
Panels of type Text are used to insert static text. The text may, for example, provide information for the dashboard users. Text panels are not connected to any metrics data.
As soon as you have added a panel to your dashboard, you can access the options for editing the panel content. For this purpose, click the panel title and use Edit:
-
For panels of type Text, a simple text editor is displayed for entering text. Plain text, HTML, and markdown format are supported.
-
For panels of type Graph and Singlestat, a query editor is displayed to define which data it to be shown. You can add multiple metrics, and apply functions to the metrics. The query results will be visualized in your panel in real time.
A large number of display and formatting features are provided to customize how the content is presented in a panel. Click the panel title to access the corresponding options. The menu that is displayed also allows you to duplicate or remove a panel. To change the size of a panel, click the + and - icons.
You can move panels on your dashboard by simply dragging and dropping them within and between rows.
By default, the time range for panels is controlled by dashboard settings. Use the time picker in the top right corner of your dashboard window to define relative or absolute time ranges. You can also set an auto-refresh interval, or manually refresh the data that is displayed.
Saving and Sharing Dashboards
SUSE OpenStack Cloud Monitoring allows you to save a metrics dashboard and export it to a JSON file. The JSON file can be edited, it can be shared with other users, and it can be imported to SUSE OpenStack Cloud Monitoring again.
To save a dashboard, use Save in the top right corner of your dashboard window. You can enter a name for the dashboard and simply save it to your browser's local storage. Use Dashboard JSON to directly view the corresponding JSON syntax, or use Export dashboard to download the JSON file. The JSON file can be forwarded to other users, if required. To import a JSON file, use Open dashboard in the top left corner of the dashboard window.