Table of Contents
Services and servers in a cloud infrastructure generate huge amounts of log data, from simply announcing that everything is healthy to detailed information on events or processes. The logs are distributed over many physical and virtual servers. SUSE OpenStack Cloud Crowbar Monitoring collects, stores, and queries these logs and makes them accessible to SUSE OpenStack Cloud Crowbar Monitoring users in one central place.
SUSE OpenStack Cloud Crowbar Monitoring covers all aspects of an enterprise-class log management solution:
Central management of log data from medium and large-size OpenStack deployments.
Buffered exchange of log data to provide high data throughput.
Logical isolation of log data through multi-tenancy.
Scalable architecture capable of mastering the data load from a large number of nodes in OpenStack environments. The log management solution can be horizontally and vertically adapted to constantly changing data loads.
For managing the log data of your services and the virtual and physical servers on which they are provisioned, SUSE OpenStack Cloud Crowbar Monitoring integrates with Kibana, an open source analytics and visualization platform. SUSE OpenStack Cloud Crowbar Monitoring uses Kibana as a front-end application to the log data held in the Elasticsearch database.
Kibana allows you to easily understand large data volumes. Based on the data that is stored in Elasticsearch indices, you can perform advanced data analysis and visualize your log data in a variety of charts, tables, or maps. Changes to the Elasticsearch indices are displayed in SUSE OpenStack Cloud Crowbar Monitoring in real time.
The log management features of SUSE OpenStack Cloud Crowbar Monitoring include:
Features for searching, visualizing, and analyzing the log data.
Alerting features for monitoring.
In the following sections, you will find information on the Log Management Window where you search, visualize, and analyze your log data, as well as details on how to use the alerting features.
Accessing SUSE OpenStack Cloud Crowbar Monitoring
For accessing SUSE OpenStack Cloud Crowbar Monitoring and performing log management tasks, the following prerequisites must be fulfilled:
You must have access to the OpenStack platform as a user with the
monasca-userrole.You must be assigned to the OpenStack project you want to monitor.
Log in to OpenStack horizon with your user name and password. The functions you can use in OpenStack horizon depend on your access permissions. To access logs and metrics, switch to the tenant in horizon.
The SUSE OpenStack Cloud Crowbar Monitoring functionality is available on the tab. It provides access to the log data of all projects to which you are assigned. The option at the top border of the page displays the log management window where you can work on the log data.
Index patterns determine which data from the underlying Elasticsearch database can be viewed and analyzed in SUSE OpenStack Cloud Crowbar Monitoring's log management window. Index patterns are used to identify the Elasticsearch indices to run search and analytics against.
SUSE OpenStack Cloud Crowbar Monitoring ships with a preconfigured index pattern which allows you to instantly view and analyze your log data when accessing the log management window for the first time. You can configure additional index patterns to view and analyze different data from different indices.
Search queries allow you to search the Elasticsearch indices for data that match your information requirements. The query results can be graphically represented in visualizations, and visualizations can be organized in dashboards.
The log management window provides features for:
Querying log data.
Visualizing query results.
Combining visualizations in dashboards.
Filtering query results in dashboards.
Sharing dashboards.
The following sections provide an introduction to queries, visualizations, and dashboards. For additional details, refer to the Kibana documentation.
For querying log data, you use the page in the log management window. It is instantly displayed when you access the window. It shows the most recently collected log data:
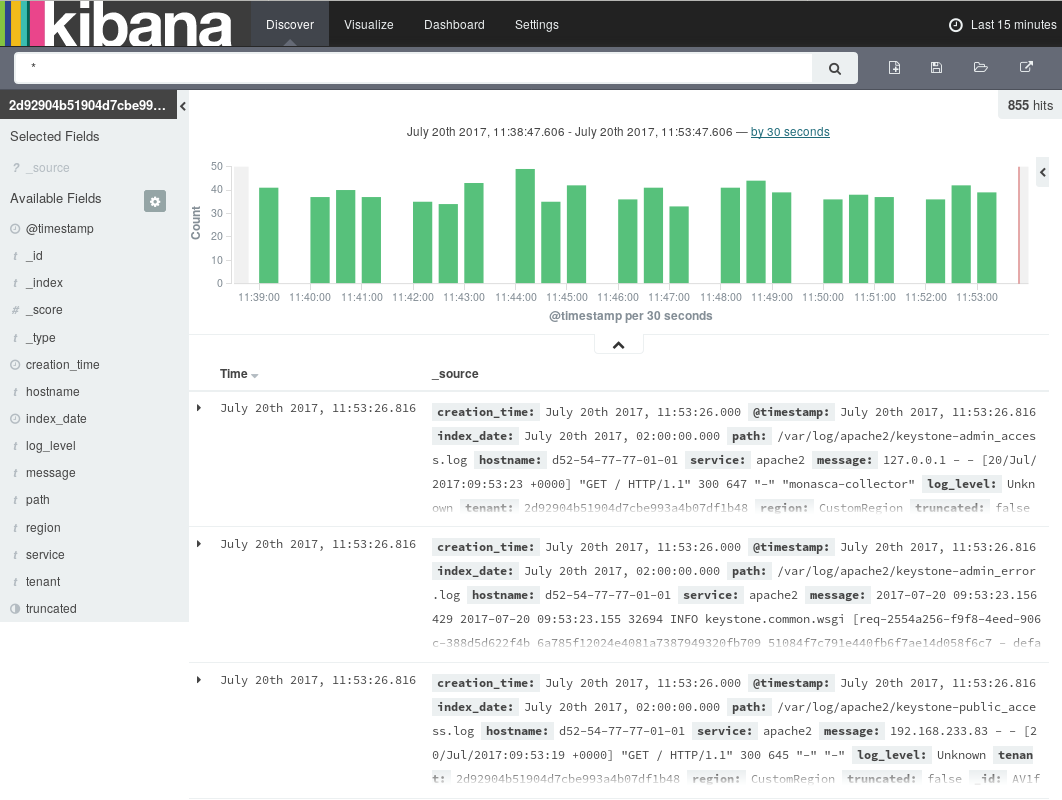
The page allows you to access the log data in every index that matches the current index pattern. In addition to submitting queries, you can view, filter, and analyze the log data that is returned by your queries.
On the page the following elements assist you in analyzing your log data:
Below the main navigation bar at the top of the window, there is a search box for querying your log data. By submitting a query, you search all indices that match the current index pattern. The name of the current index pattern is displayed directly below the search box on the left side. You can select a different index pattern, if required.
For entering strings in the search box, use the Lucene query syntax. Kibana also supports the Elasticsearch Query DSL. For details, refer to the Elasticsearch Reference documentation.
Use the clock icon at the top right border of the log management window to define a time range for filtering the log data. By default, SUSE OpenStack Cloud Crowbar Monitoring displays the log data collected during the last 15 minutes. You can deviate from this default. Multiple options are provided for defining relative or absolute time ranges. The time range you define is instantly applied to all log data.
In the bottom right part of the page, you can view the log data returned by your search queries. Depending on whether you have filtered the data by index fields, the log data is either restricted to these fields or entire records are displayed.
On the left side of the page below the search box, you see the index fields from the indices that match the current index pattern. You can select individual fields to modify which log data is displayed on the right side.
Select a field from the section for this purpose and use . To remove a field, select it in the section and use .
From the field list, you can expand a field by simply clicking it. This shows the most common values for the field. You can also set field values as filter, or you can exclude log data with specific field values.
If a time field is configured for the current index pattern, the distribution of log entries over time is displayed in a histogram in the top right part of the page.
By default, the histogram shows the number of logs entries versus time, matched by the underlying query and time filter. You can click the bars in the histogram to narrow down the time filter.
Queries can be saved and re-used. They can also be shared with other users. For this purpose, use the options to the right of the search box at the top border of the log management window:
To save a query, use . Saving a query means saving both the query syntax and the current index pattern.
To load a query, use . A saved query can be loaded and used by any OpenStack or Monitoring Service operator.
To share a query with other users, use . The option displays a direct link to the query that you can forward. As a prerequisite for using a direct link, a user must have SUSE OpenStack Cloud Crowbar Monitoring access.
SUSE OpenStack Cloud Crowbar Monitoring supports you in building graphical representations of your query results. You can choose from different visualization types, for example, pie charts, data tables, line charts, or vertical bar charts. For visualizing your results, you use the page in the log management window:
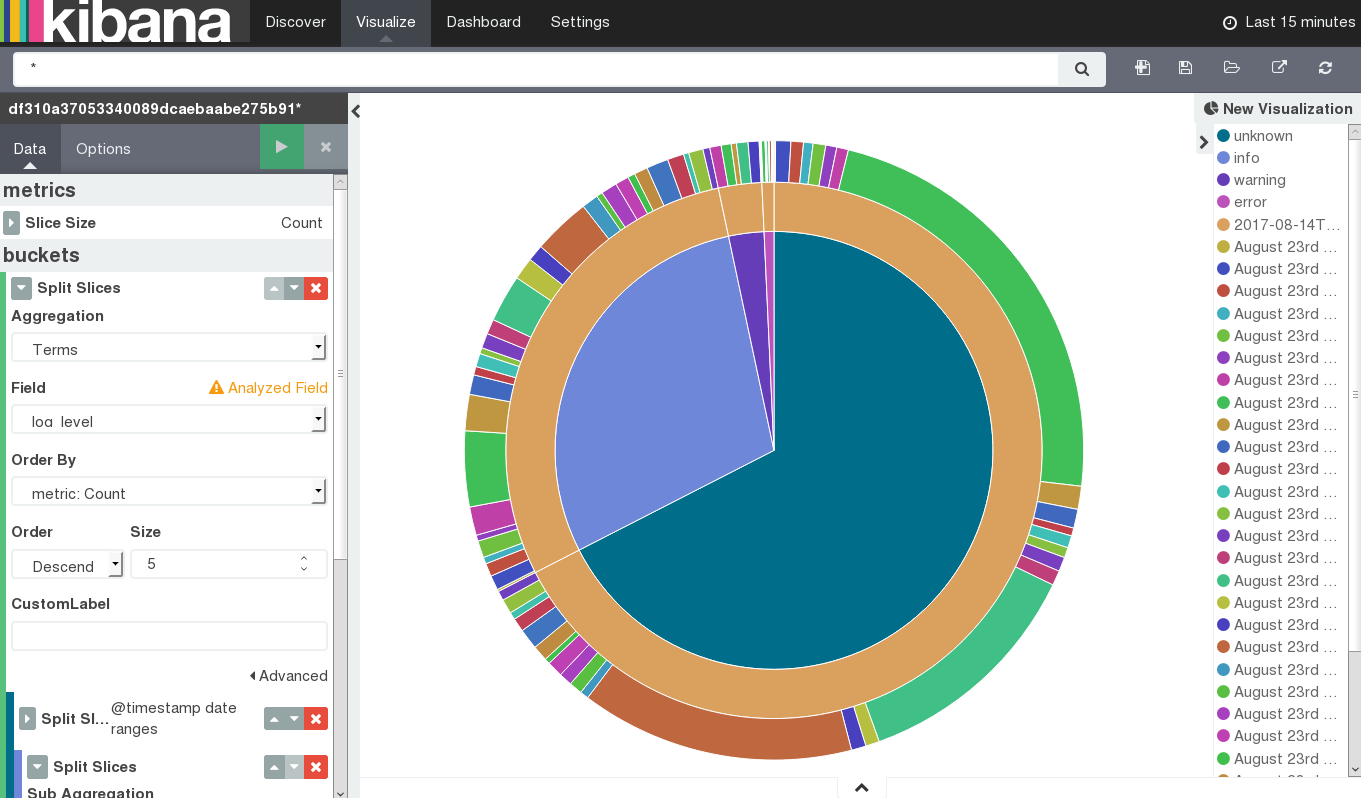 |
To create a visualization, use to the right of the search box at the top border of the window. You have to select a visualization type and the query to be used. You can either create a new query or load a query you have already saved.
Based on the visualization type and the query, you can proceed with designing the graphical representation in a visualization editor. Multiple design options and a preview function are provided for creating, modifying, and viewing the graphical representation.
You can save and re-use visualizations. You can also share them with other users. For this purpose, use the options to the right of the search box at the top border of the log management window:
To save a visualization, use .
To load a visualization, use . A saved visualization can be loaded and used by any OpenStack or Monitoring Service operator.
To share a visualization with other users, use . The option displays an HTML snippet that can be used to embed the visualization in a Web page. It also displays a direct link to the visualization that you can forward. As a prerequisite for using an embedded visualization or a direct link, a user must have SUSE OpenStack Cloud Crowbar Monitoring access.
For correlating related information or providing an overview, you can combine visualizations in dashboards. Use the page in the log management window for this purpose:
To create a dashboard from scratch, you use to the right of the search box at the top border of the window. To add a visualization from a list of existing visualizations, use . You need at least one saved visualization to create a dashboard. In addition to adding visualizations, you can also place the tabular output of query results on your dashboards. Switch to the tab when adding a visualization, and select a saved query. This adds the query result to your dashboard.
A visualization or query result is displayed in a container on your dashboard. Various options are provided for arranging containers:
Move a container by clicking and dragging its title bar.
Resize a container by dragging its bottom right corner.
Remove a container using in the top right corner of the container.
Using in the top right corner of a container, you can switch to the or page. This allows you to design the graphical representation or edit the query. To view the raw data behind a visualization, you can click the bar at the bottom of the container. This replaces your visualization by the underlying raw data. You can export the raw data, if required.
For each dashboard, you can configure a refresh interval to automatically refresh its content with the latest data. The current interval is displayed in the top right border of the log management window. Click the interval if you want to change it. You can define the interval in absolute or relative terms. Use next to the interval in the border of the log management window to instantly submit the underlying queries and refresh the dashboard content.
By default, dashboards are displayed with a light background. Using in the top right border of the log management window, you can switch to a dark color scheme.
By submitting a query on the data displayed in a dashboard, you can filter out specific sets of data that you want to aggregate while not changing the logic of the individual visualizations.
Use the search box below the main navigation bar at the top of the log management window for entering a query on the whole dashboard. If a visualization is already based on a saved query, both queries apply.
Dashboards can be saved and re-used. They can also be shared with other users. For this purpose, use the options to the right of the search box at the top border of the log management window:
To save a dashboard, use . By default, saving a dashboard also saves the time filter that is defined at the time of saving. You can disable this default by clearing the option. Disabling the default means that the time filter is set to the currently selected time each time the dashboard is loaded.
To load a dashboard, use . A saved dashboard can be loaded and used by any OpenStack or Monitoring Service operator.
To share a dashboard with other users, use . The option displays an HTML snippet that can be used to embed the dashboard in a Web page. It also displays a direct link to the dashboard that you can forward. As a prerequisite for using an embedded dashboard or a direct link, a user must have SUSE OpenStack Cloud Crowbar Monitoring access.